1
2
3
4
5
6
7
8
9
10
11
12
13
14
15
16
17
18
19
20
21
22
23
24
25
26
27
28
29
30
31
32
33
34
35
36
37
38
39
40
41
42
43
44
45
46
47
48
49
50
51
52
53
54
55
56
57
58
59
60
61
62
63
64
65
66
67
68
69
70
71
72
73
74
75
76
77
78
79
80
81
82
83
84
85
86
87
88
89
90
91
92
93
94
95
96
97
98
99
100
101
102
103
104
105
106
107
108
109
110
111
112
113
114
115
116
117
118
119
120
121
122
123
124
125
126
127
128
129
130
131
132
133
134
135
136
137
138
139
140
141
142
143
144
145
146
147
148
149
150
151
152
153
154
155
156
157
158
159
160
161
162
163
164
165
166
167
168
169
170
171
172
173
174
175
176
177
178
179
180
181
182
183
184
185
186
187
188
189
190
191
192
193
194
195
196
197
198
199
200
201
202
203
204
205
206
207
208
209
210
211
212
213
214
215
216
217
218
219
220
221
222
223
224
225
226
227
228
229
230
231
232
233
234
235
236
237
238
239
240
241
242
243
244
245
246
247
248
249
250
251
252
253
254
255
256
257
258
259
260
261
262
263
264
265
266
267
268
269
270
271
272
273
274
275
276
277
278
279
280
281
282
283
284
285
286
287
288
289
290
291
292
293
294
295
296
297
298
299
300
301
302
303
304
305
306
307
308
309
310
311
312
313
314
315
316
317
318
319
320
321
322
323
324
325
326
327
328
329
330
331
332
333
334
335
336
337
338
339
340
341
342
343
344
345
346
347
348
349
350
351
352
353
354
355
356
357
358
359
360
361
362
363
364
365
366
367
368
369
370
371
372
373
374
375
376
377
378
379
380
381
382
383
384
385
386
387
388
389
390
391
392
393
394
395
396
397
398
399
400
401
402
403
404
405
406
407
408
409
410
411
412
413
414
415
416
417
418
419
420
421
422
423
424
425
426
427
428
429
430
431
432
433
434
435
436
437
438
439
440
441
442
443
444
445
446
447
448
449
450
451
452
453
454
455
456
457
458
459
460
461
462
463
464
465
466
467
468
469
470
471
472
473
474
475
476
477
478
479
480
481
482
483
484
485
486
487
488
489
490
491
492
493
494
495
496
497
498
499
500
501
502
503
504
505
506
507
508
509
510
511
512
513
514
515
516
517
518
519
520
521
522
523
524
525
526
527
528
529
530
531
532
533
534
535
536
537
538
539
540
541
542
543
544
545
546
547
548
549
550
551
552
553
554
555
556
557
558
559
560
561
562
563
564
565
566
567
568
569
570
571
572
573
574
575
576
577
578
579
580
581
582
583
584
585
586
587
588
589
590
591
592
593
594
595
596
597
598
599
600
601
602
603
604
605
606
607
608
609
610
611
612
613
614
615
616
617
618
619
620
621
622
623
624
625
626
627
628
629
630
631
632
633
634
635
636
637
638
639
640
641
642
643
644
645
646
647
648
649
650
651
652
653
654
655
656
657
658
659
660
661
662
663
664
665
666
667
668
669
670
671
672
673
674
675
676
677
678
679
680
681
682
683
684
685
686
687
688
689
690
691
692
693
694
695
696
697
698
699
700
701
702
703
704
705
706
707
708
709
710
711
712
713
714
715
716
717
718
719
720
721
722
723
724
725
726
727
728
729
730
731
732
733
734
735
736
737
738
739
740
741
742
743
744
745
746
747
748
749
750
751
752
753
754
755
756
757
758
759
760
761
762
763
764
765
766
767
768
769
770
771
772
773
774
775
776
777
778
779
780
781
782
783
784
785
786
787
788
789
790
791
792
793
794
795
796
797
798
799
800
801
802
803
|
# Debugging TensorFlow Programs
<!-- [comment]: TODO(barryr): Links to and from sections on "Graphs" & "Monitoring Learning". -->
[TOC]
TensorFlow debugger (**tfdbg**) is a specialized debugger for TensorFlow. It
lets you view the internal structure and states of running TensorFlow graphs
during training and inference, which is difficult to debug with general-purpose
debuggers such as Python's `pdb` due to TensorFlow's computation-graph paradigm.
> NOTE: TensorFlow debugger uses a
> [curses](https://en.wikipedia.org/wiki/Curses_\(programming_library\))-based
> text user interface. On Mac OS X, the `ncurses` library is required and can
> be installed with `brew install homebrew/dupes/ncurses`. On Windows, curses
> isn't as well supported, so a
> [readline](https://en.wikipedia.org/wiki/GNU_Readline)-based interface can
> be used with tfdbg by installing `pyreadline` with pip.
> If you use Anaconda3, you can install it with a command
> such as `"C:\Program Files\Anaconda3\Scripts\pip.exe" install pyreadline`.
> Unofficial Windows curses packages can be downloaded
> [here](https://www.lfd.uci.edu/~gohlke/pythonlibs/#curses), then subsequently
> installed using `pip install <your_version>.whl`, however curses on Windows
> may not work as reliably as curses on Linux or Mac.
This tutorial demonstrates how to use the **tfdbg** command-line interface
(CLI) to debug the appearance of [`nan`s](https://en.wikipedia.org/wiki/NaN)
and [`inf`s](https://en.wikipedia.org/wiki/Infinity), a frequently-encountered
type of bug in TensorFlow model development.
The following example is for users who use the low-level
[`Session`](https://www.tensorflow.org/api_docs/python/tf/Session) API of
TensorFlow. A later section of this document describes how to use **tfdbg**
with a higher-level API, namely tf-learn `Estimator`s and `Experiment`s.
To *observe* such an issue, run the following command without the debugger (the
source code can be found
[here](https://github.com/tensorflow/tensorflow/blob/master/tensorflow/python/debug/examples/debug_mnist.py)):
```none
python -m tensorflow.python.debug.examples.debug_mnist
```
This code trains a simple neural network for MNIST digit image recognition.
Notice that the accuracy increases slightly after the first training step, but
then gets stuck at a low (near-chance) level:
```none
Accuracy at step 0: 0.1113
Accuracy at step 1: 0.3183
Accuracy at step 2: 0.098
Accuracy at step 3: 0.098
Accuracy at step 4: 0.098
```
Wondering what might have gone wrong, you suspect that certain nodes in the
training graph generated bad numeric values such as `inf`s and `nan`s, because
this is a common cause of this type of training failure.
Let's use tfdbg to debug this issue and pinpoint the exact graph node where this
numeric problem first surfaced.
## Wrapping TensorFlow Sessions with tfdbg
To add support for tfdbg in our example, all that is needed is to add the
following lines of code and wrap the Session object with a debugger wrapper.
This code is already added in
[debug_mnist.py](https://github.com/tensorflow/tensorflow/blob/master/tensorflow/python/debug/examples/debug_mnist.py),
so you can activate tfdbg CLI with the `--debug` flag at the command line.
```python
# Let your BUILD target depend on "//tensorflow/python/debug:debug_py"
# (You don't need to worry about the BUILD dependency if you are using a pip
# install of open-source TensorFlow.)
from tensorflow.python import debug as tf_debug
sess = tf_debug.LocalCLIDebugWrapperSession(sess)
```
This wrapper has the same interface as Session, so enabling debugging requires
no other changes to the code. The wrapper provides additional features,
including:
* Bringing up a CLI before and after `Session.run()` calls, to let you
control the execution and inspect the graph's internal state.
* Allowing you to register special `filters` for tensor values, to facilitate
the diagnosis of issues.
In this example, we have already registered a tensor filter called
@{tfdbg.has_inf_or_nan},
which simply determines if there are any `nan` or `inf` values in any
intermediate tensors (tensors that are neither inputs or outputs of the
`Session.run()` call, but are in the path leading from the inputs to the
outputs). This filter is for `nan`s and `inf`s is a common enough use case that
we ship it with the
@{$python/tfdbg#Classes_for_debug_dump_data_and_directories$`debug_data`}
module.
Note: You can also write your own custom filters. See
the @{tfdbg.DebugDumpDir.find$API documentation}
of `DebugDumpDir.find()` for additional information.
## Debugging Model Training with tfdbg
Let's try training the model again, but with the `--debug` flag added this time:
```none
python -m tensorflow.python.debug.examples.debug_mnist --debug
```
The debug wrapper session will prompt you when it is about to execute the first
`Session.run()` call, with information regarding the fetched tensor and feed
dictionaries displayed on the screen.
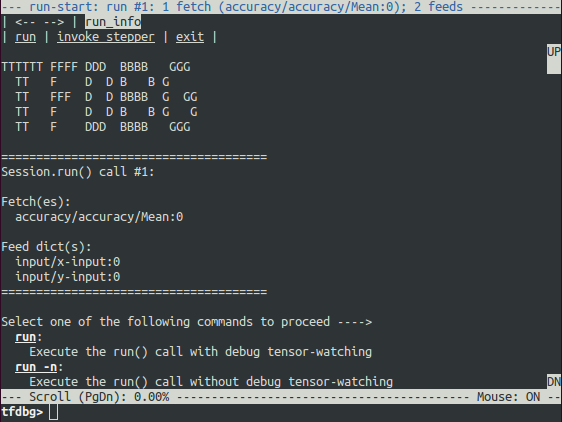
This is what we refer to as the *run-start CLI*. It lists the feeds and fetches
to the current `Session.run` call, before executing anything.
If the screen size is too small to display the content of the message in its
entirety, you can resize it.
Use the **PageUp** / **PageDown** / **Home** / **End** keys to navigate the
screen output. On most keyboards lacking those keys **Fn + Up** /
**Fn + Down** / **Fn + Right** / **Fn + Left** will work.
Enter the `run` command (or just `r`) at the command prompt:
```
tfdbg> run
```
The `run` command causes tfdbg to execute until the end of the next
`Session.run()` call, which calculates the model's accuracy using a test data
set. tfdbg augments the runtime Graph to dump all intermediate tensors.
After the run ends, tfdbg displays all the dumped tensors values in the
*run-end CLI*. For example:
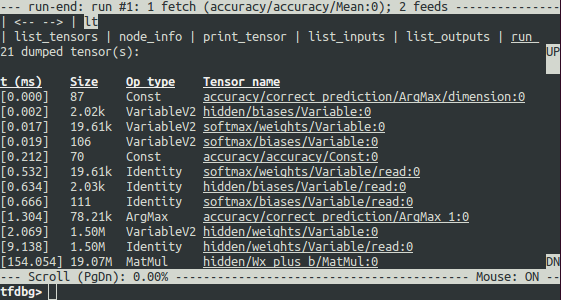
This list of tensors can also be obtained by running the command `lt` after you
executed `run`.
### tfdbg CLI Frequently-Used Commands
Try the following commands at the `tfdbg>` prompt (referencing the code at
`tensorflow/python/debug/examples/debug_mnist.py`):
| Command | Syntax or Option | Explanation | Example |
|:-------------------|:---------------- |:------------ |:------------------------- |
| **`lt`** | | **List dumped tensors.** | `lt` |
| | `-n <name_pattern>` | List dumped tensors with names matching given regular-expression pattern. | `lt -n Softmax.*` |
| | `-t <op_pattern>` | List dumped tensors with op types matching given regular-expression pattern. | `lt -t MatMul` |
| | `-f <filter_name>` | List only the tensors that pass a registered tensor filter. | `lt -f has_inf_or_nan` |
| | `-s <sort_key>` | Sort the output by given `sort_key`, whose possible values are `timestamp` (default), `dump_size`, `op_type` and `tensor_name`. | `lt -s dump_size` |
| | `-r` | Sort in reverse order. | `lt -r -s dump_size` |
| **`pt`** | | **Print value of a dumped tensor.** | |
| | `pt <tensor>` | Print tensor value. | `pt hidden/Relu:0` |
| | `pt <tensor>[slicing]` | Print a subarray of tensor, using [numpy](http://www.numpy.org/)-style array slicing. | `pt hidden/Relu:0[0:50,:]` |
| | `-a` | Print the entirety of a large tensor, without using ellipses. (May take a long time for large tensors.) | `pt -a hidden/Relu:0[0:50,:]` |
| | `-r <range>` | Highlight elements falling into specified numerical range. Multiple ranges can be used in conjunction. | `pt hidden/Relu:0 -a -r [[-inf,-1],[1,inf]]` |
| | `-s` | Include a summary of the numeric values of the tensor (applicable only to non-empty tensors with Boolean and numeric types such as `int*` and `float*`.) | `pt -s hidden/Relu:0[0:50,:]` |
| **`@[coordinates]`** | | Navigate to specified element in `pt` output. | `@[10,0]` or `@10,0` |
| **`/regex`** | | [less](https://linux.die.net/man/1/less)-style search for given regular expression. | `/inf` |
| **`/`** | | Scroll to the next line with matches to the searched regex (if any). | `/` |
| **`pf`** | | **Print a value in the feed_dict to `Session.run`.** | |
| | `pf <feed_tensor_name>` | Print the value of the feed. Also note that the `pf` command has the `-a`, `-r` and `-s` flags (not listed below), which have the same syntax and semantics as the identically-named flags of `pt`. | `pf input_xs:0` |
| **eval** | | **Evaluate arbitrary Python and numpy expression.** | |
| | `eval <expression>` | Evaluate a Python / numpy expression, with numpy available as `np` and debug tensor names enclosed in backticks. | ``eval "np.matmul((`output/Identity:0` / `Softmax:0`).T, `Softmax:0`)"`` |
| | `-a` | Print a large-sized evaluation result in its entirety, i.e., without using ellipses. | ``eval -a 'np.sum(`Softmax:0`, axis=1)'`` |
| **`ni`** | | **Display node information.** | |
| | `-a` | Include node attributes in the output. | `ni -a hidden/Relu` |
| | `-d` | List the debug dumps available from the node. | `ni -d hidden/Relu` |
| | `-t` | Display the Python stack trace of the node's creation. | `ni -t hidden/Relu` |
| **`li`** | | **List inputs to node** | |
| | `-r` | List the inputs to node, recursively (the input tree.) | `li -r hidden/Relu:0` |
| | `-d <max_depth>` | Limit recursion depth under the `-r` mode. | `li -r -d 3 hidden/Relu:0` |
| | `-c` | Include control inputs. | `li -c -r hidden/Relu:0` |
| **`lo`** | | **List output recipients of node** | |
| | `-r` | List the output recipients of node, recursively (the output tree.) | `lo -r hidden/Relu:0` |
| | `-d <max_depth>` | Limit recursion depth under the `-r` mode. | `lo -r -d 3 hidden/Relu:0` |
| | `-c` | Include recipients via control edges. | `lo -c -r hidden/Relu:0` |
| **`ls`** | | **List Python source files involved in node creation.** | |
| | `-p <path_pattern>` | Limit output to source files matching given regular-expression path pattern. | `ls -p .*debug_mnist.*` |
| | `-n` | Limit output to node names matching given regular-expression pattern. | `ls -n Softmax.*` |
| **`ps`** | | **Print Python source file.** | |
| | `ps <file_path>` | Print given Python source file source.py, with the lines annotated with the nodes created at each of them (if any). | `ps /path/to/source.py` |
| | `-t` | Perform annotation with respect to Tensors, instead of the default, nodes. | `ps -t /path/to/source.py` |
| | `-b <line_number>` | Annotate source.py beginning at given line. | `ps -b 30 /path/to/source.py` |
| | `-m <max_elements>` | Limit the number of elements in the annotation for each line. | `ps -m 100 /path/to/source.py` |
| **`run`** | | **Proceed to the next Session.run()** | `run` |
| | `-n` | Execute through the next `Session.run` without debugging, and drop to CLI right before the run after that. | `run -n` |
| | `-t <T>` | Execute `Session.run` `T - 1` times without debugging, followed by a run with debugging. Then drop to CLI right after the debugged run. | `run -t 10` |
| | `-f <filter_name>` | Continue executing `Session.run` until any intermediate tensor triggers the specified Tensor filter (causes the filter to return `True`). | `run -f has_inf_or_nan` |
| | `--node_name_filter <pattern>` | Execute the next `Session.run`, watching only nodes with names matching the given regular-expression pattern. | `run --node_name_filter Softmax.*` |
| | `--op_type_filter <pattern>` | Execute the next `Session.run`, watching only nodes with op types matching the given regular-expression pattern. | `run --op_type_filter Variable.*` |
| | `--tensor_dtype_filter <pattern>` | Execute the next `Session.run`, dumping only Tensors with data types (`dtype`s) matching the given regular-expression pattern. | `run --tensor_dtype_filter int.*` |
| | `-p` | Execute the next `Session.run` call in profiling mode. | `run -p` |
| **`ri`** | | **Display information about the run the current run, including fetches and feeds.** | `ri` |
| **`config`** | | **Set or show persistent TFDBG UI configuration.** | |
| | `set` | Set the value of a config item: {`graph_recursion_depth`, `mouse_mode`}. | `config set graph_recursion_depth 3` |
| | `show` | Show current persistent UI configuration. | `config show` |
| **`help`** | | **Print general help information** | `help` |
| | `help <command>` | Print help for given command. | `help lt` |
Note that each time you enter a command, a new screen output
will appear. This is somewhat analogous to web pages in a browser. You can
navigate between these screens by clicking the `<--` and
`-->` text arrows near the top-left corner of the CLI.
### Other Features of the tfdbg CLI
In addition to the commands listed above, the tfdbg CLI provides the following
addditional features:
* To navigate through previous tfdbg commands, type in a few characters
followed by the Up or Down arrow keys. tfdbg will show you the history of
commands that started with those characters.
* To navigate through the history of screen outputs, do either of the
following:
* Use the `prev` and `next` commands.
* Click underlined `<--` and `-->` links near the top left corner of the
screen.
* Tab completion of commands and some command arguments.
* To redirect the screen output to a file instead of the screen, end the
command with bash-style redirection. For example, the following command
redirects the output of the pt command to the `/tmp/xent_value_slices.txt`
file:
```none
tfdbg> pt cross_entropy/Log:0[:, 0:10] > /tmp/xent_value_slices.txt
```
### Finding `nan`s and `inf`s
In this first `Session.run()` call, there happen to be no problematic numerical
values. You can move on to the next run by using the command `run` or its
shorthand `r`.
> TIP: If you enter `run` or `r` repeatedly, you will be able to move through
> the `Session.run()` calls in a sequential manner.
>
> You can also use the `-t` flag to move ahead a number of `Session.run()` calls
> at a time, for example:
>
> ```
> tfdbg> run -t 10
> ```
Instead of entering `run` repeatedly and manually searching for `nan`s and
`inf`s in the run-end UI after every `Session.run()` call (for example, by using
the `pt` command shown in the table above) , you can use the following
command to let the debugger repeatedly execute `Session.run()` calls without
stopping at the run-start or run-end prompt, until the first `nan` or `inf`
value shows up in the graph. This is analogous to *conditional breakpoints* in
some procedural-language debuggers:
```none
tfdbg> run -f has_inf_or_nan
```
> NOTE: The preceding command works properly because a tensor filter called
> `has_inf_or_nan` has been registered for you when the wrapped session is
> created. This filter detects `nan`s and `inf`s (as explained previously).
> If you have registered any other filters, you can
> use "run -f" to have tfdbg run until any tensor triggers that filter (cause
> the filter to return True).
>
> ``` python
> def my_filter_callable(datum, tensor):
> # A filter that detects zero-valued scalars.
> return len(tensor.shape) == 0 and tensor == 0.0
>
> sess.add_tensor_filter('my_filter', my_filter_callable)
> ```
>
> Then at the tfdbg run-start prompt run until your filter is triggered:
>
> ```
> tfdbg> run -f my_filter
> ```
See [this API document](https://www.tensorflow.org/api_docs/python/tfdbg/DebugDumpDir#find)
for more information on the expected signature and return value of the predicate
`Callable` used with `add_tensor_filter()`.
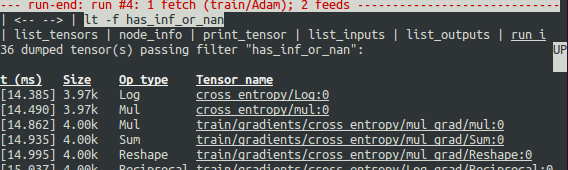
As the screen display indicates on the first line, the `has_inf_or_nan` filter is first triggered
during the fourth `Session.run()` call: an
[Adam optimizer](https://www.tensorflow.org/api_docs/python/tf/train/AdamOptimizer)
forward-backward training pass on the graph. In this run, 36 (out of the total
95) intermediate tensors contain `nan` or `inf` values. These tensors are listed
in chronological order, with their timestamps displayed on the left. At the top
of the list, you can see the first tensor in which the bad numerical values
first surfaced: `cross_entropy/Log:0`.
To view the value of the tensor, click the underlined tensor name
`cross_entropy/Log:0` or enter the equivalent command:
```none
tfdbg> pt cross_entropy/Log:0
```
Scroll down a little and you will notice some scattered `inf` values. If the
instances of `inf` and `nan` are difficult to spot by eye, you can use the
following command to perform a regex search and highlight the output:
```none
tfdbg> /inf
```
Or, alternatively:
```none
tfdbg> /(inf|nan)
```
You can also use the `-s` or `--numeric_summary` command to get a quick summary
of the types of numeric values in the tensor:
``` none
tfdbg> pt -s cross_entropy/Log:0
```
From the summary, you can see that several of the 1000 elements of the
`cross_entropy/Log:0` tensor are `-inf`s (negative infinities).
Why did these infinities appear? To further debug, display more information
about the node `cross_entropy/Log` by clicking the underlined `node_info` menu
item on the top or entering the equivalent node_info (`ni`) command:
```none
tfdbg> ni cross_entropy/Log
```
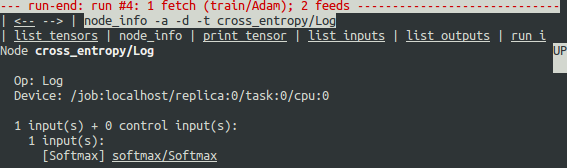
You can see that this node has the op type `Log`
and that its input is the node `softmax/Softmax`. Run the following command to
take a closer look at the input tensor:
```none
tfdbg> pt softmax/Softmax:0
```
Examine the values in the input tensor, searching for zeros:
```none
tfdbg> /0\.000
```
Indeed, there are zeros. Now it is clear that the origin of the bad numerical
values is the node `cross_entropy/Log` taking logs of zeros. To find out the
culprit line in the Python source code, use the `-t` flag of the `ni` command
to show the traceback of the node's construction:
```none
tfdbg> ni -t cross_entropy/Log
```
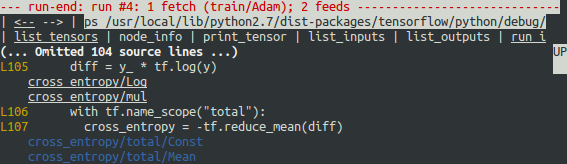
If you click "node_info" at the top of the screen, tfdbg automatically shows the
traceback of the node's construction.
From the traceback, you can see that the op is constructed at the following
line:
[`debug_mnist.py`](https://www.tensorflow.org/code/tensorflow/python/debug/examples/debug_mnist.py):
```python
diff = y_ * tf.log(y)
```
**tfdbg** has a feature that makes it easy to trace Tensors and ops back to
lines in Python source files. It can annotate lines of a Python file with
the ops or Tensors created by them. To use this feature,
simply click the underlined line numbers in the stack trace output of the
`ni -t <op_name>` commands, or use the `ps` (or `print_source`) command such as:
`ps /path/to/source.py`. For example, the following screenshot shows the output
of a `ps` command.
### Fixing the problem
To fix the problem, edit `debug_mnist.py`, changing the original line:
```python
diff = -(y_ * tf.log(y))
```
to the built-in, numerically-stable implementation of softmax cross-entropy:
```python
diff = tf.nn.softmax_cross_entropy_with_logits(labels=y_, logits=logits)
```
Rerun with the `--debug` flag as follows:
```none
python -m tensorflow.python.debug.examples.debug_mnist --debug
```
At the `tfdbg>` prompt, enter the following command:
```none
run -f has_inf_or_nan`
```
Confirm that no tensors are flagged as containing `nan` or `inf` values, and
accuracy now continues to rise rather than getting stuck. Success!
## Debugging tf-learn Estimators and Experiments
This section explains how to debug TensorFlow programs that use the `Estimator`
and `Experiment` APIs. Part of the convenience provided by these APIs is that
they manage `Session`s internally. This makes the `LocalCLIDebugWrapperSession`
described in the preceding sections inapplicable. Fortunately, you can still
debug them by using special `hook`s provided by `tfdbg`.
### Debugging tf.contrib.learn Estimators
Currently, `tfdbg` can debug the
@{tf.contrib.learn.BaseEstimator.fit$`fit()`}
@{tf.contrib.learn.BaseEstimator.evaluate$`evaluate()`}
methods of tf-learn `Estimator`s. To debug `Estimator.fit()`,
create a `LocalCLIDebugHook` and supply it in the `monitors` argument. For example:
```python
# First, let your BUILD target depend on "//tensorflow/python/debug:debug_py"
# (You don't need to worry about the BUILD dependency if you are using a pip
# install of open-source TensorFlow.)
from tensorflow.python import debug as tf_debug
# Create a LocalCLIDebugHook and use it as a monitor when calling fit().
hooks = [tf_debug.LocalCLIDebugHook()]
classifier.fit(x=training_set.data,
y=training_set.target,
steps=1000,
monitors=hooks)
```
To debug `Estimator.evaluate()`, assign hooks to the `hooks` parameter, as in
the following example:
```python
accuracy_score = classifier.evaluate(x=test_set.data,
y=test_set.target,
hooks=hooks)["accuracy"]
```
[debug_tflearn_iris.py](https://www.tensorflow.org/code/tensorflow/python/debug/examples/debug_tflearn_iris.py),
based on {$tflearn$tf-learn's iris tutorial}, contains a full example of how to
use the tfdbg with `Estimator`s. To run this example, do:
```none
python -m tensorflow.python.debug.examples.debug_tflearn_iris --debug
```
### Debugging tf.contrib.learn Experiments
`Experiment` is a construct in `tf.contrib.learn` at a higher level than
`Estimator`.
It provides a single interface for training and evaluating a model. To debug
the `train()` and `evaluate()` calls to an `Experiment` object, you can
use the keyword arguments `train_monitors` and `eval_hooks`, respectively, when
calling its constructor. For example:
```python
# First, let your BUILD target depend on "//tensorflow/python/debug:debug_py"
# (You don't need to worry about the BUILD dependency if you are using a pip
# install of open-source TensorFlow.)
from tensorflow.python import debug as tf_debug
hooks = [tf_debug.LocalCLIDebugHook()]
ex = experiment.Experiment(classifier,
train_input_fn=iris_input_fn,
eval_input_fn=iris_input_fn,
train_steps=FLAGS.train_steps,
eval_delay_secs=0,
eval_steps=1,
train_monitors=hooks,
eval_hooks=hooks)
ex.train()
accuracy_score = ex.evaluate()["accuracy"]
```
To build and run the `debug_tflearn_iris` example in the `Experiment` mode, do:
```none
python -m tensorflow.python.debug.examples.debug_tflearn_iris \
--use_experiment --debug
```
The `LocalCLIDebugHook` also allows you to configure a `watch_fn` that can be
used to flexibly specify what `Tensor`s to watch on different `Session.run()`
calls, as a function of the `fetches` and `feed_dict` and other states. See
@{tfdbg.DumpingDebugWrapperSession.__init__$this API doc}
for more details.
## Debugging Keras Models with TFDBG
To use TFDBG with [Keras](https://keras.io/), let the Keras backend use
a TFDBG-wrapped Session object. For example, to use the CLI wrapper:
``` python
import tensorflow as tf
from keras import backend as keras_backend
from tensorflow.python import debug as tf_debug
keras_backend.set_session(tf_debug.LocalCLIDebugWrapperSession(tf.Session()))
# Define your keras model, called "model".
model.fit(...) # This will break into the TFDBG CLI.
```
## Debugging tf-slim with TFDBG
TFDBG supports debugging of training and evaluation with
[tf-slim](https://github.com/tensorflow/tensorflow/tree/master/tensorflow/contrib/slim).
As detailed below, training and evaluation require slightly different debugging
workflows.
### Debugging training in tf-slim
To debug the training process, provide `LocalCLIDebugWrapperSession` to the
`session_wrapper` argument of `slim.learning.train()`. For example:
``` python
import tensorflow as tf
from tensorflow.python import debug as tf_debug
# ... Code that creates the graph and the train_op ...
tf.contrib.slim.learning.train(
train_op,
logdir,
number_of_steps=10,
session_wrapper=tf_debug.LocalCLIDebugWrapperSession)
```
### Debugging evaluation in tf-slim
To debug the evaluation process, provide `LocalCLIDebugHook` to the
`hooks` argument of `slim.evaluation.evaluate_once()`. For example:
``` python
import tensorflow as tf
from tensorflow.python import debug as tf_debug
# ... Code that creates the graph and the eval and final ops ...
tf.contrib.slim.evaluation.evaluate_once(
'',
checkpoint_path,
logdir,
eval_op=my_eval_op,
final_op=my_value_op,
hooks=[tf_debug.LocalCLIDebugHook()])
```
## Offline Debugging of Remotely-Running Sessions
Often, your model is running on a remote machine or a process that you don't
have terminal access to. To perform model debugging in such cases, you can use
the `offline_analyzer` binary of `tfdbg` (described below). It operates on
dumped data directories. This can be done to both the lower-level `Session` API
and the higher-level `Estimator` and `Experiment` APIs.
### Debugging Remote tf.Sessions
If you interact directly with the `tf.Session` API in `python`, you can
configure the `RunOptions` proto that you call your `Session.run()` method
with, by using the method @{tfdbg.watch_graph}.
This will cause the intermediate tensors and runtime graphs to be dumped to a
shared storage location of your choice when the `Session.run()` call occurs
(at the cost of slower performance). For example:
```python
from tensorflow.python import debug as tf_debug
# ... Code where your session and graph are set up...
run_options = tf.RunOptions()
tf_debug.watch_graph(
run_options,
session.graph,
debug_urls=["file:///shared/storage/location/tfdbg_dumps_1"])
# Be sure to specify different directories for different run() calls.
session.run(fetches, feed_dict=feeds, options=run_options)
```
Later, in an environment that you have terminal access to (for example, a local
computer that can access the shared storage location specified in the code
above), you can load and inspect the data in the dump directory on the shared
storage by using the `offline_analyzer` binary of `tfdbg`. For example:
```none
python -m tensorflow.python.debug.cli.offline_analyzer \
--dump_dir=/shared/storage/location/tfdbg_dumps_1
```
The `Session` wrapper `DumpingDebugWrapperSession` offers an easier and more
flexible way to generate file-system dumps that can be analyzed offline.
To use it, simply wrap your session in a `tf_debug.DumpingDebugWrapperSession`.
For example:
```python
# Let your BUILD target depend on "//tensorflow/python/debug:debug_py
# (You don't need to worry about the BUILD dependency if you are using a pip
# install of open-source TensorFlow.)
from tensorflow.python import debug as tf_debug
sess = tf_debug.DumpingDebugWrapperSession(
sess, "/shared/storage/location/tfdbg_dumps_1/", watch_fn=my_watch_fn)
```
The `watch_fn` argument accepts a `Callable` that allows you to configure what
`tensor`s to watch on different `Session.run()` calls, as a function of the
`fetches` and `feed_dict` to the `run()` call and other states.
### C++ and other languages
If your model code is written in C++ or other languages, you can also
modify the `debug_options` field of `RunOptions` to generate debug dumps that
can be inspected offline. See
[the proto definition](https://www.tensorflow.org/code/tensorflow/core/protobuf/debug.proto)
for more details.
### Debugging Remotely-Running tf-learn Estimators and Experiments
If your remote TensorFlow server runs `Estimator`s,
you can use the non-interactive `DumpingDebugHook`. For example:
```python
# Let your BUILD target depend on "//tensorflow/python/debug:debug_py
# (You don't need to worry about the BUILD dependency if you are using a pip
# install of open-source TensorFlow.)
from tensorflow.python import debug as tf_debug
hooks = [tf_debug.DumpingDebugHook("/shared/storage/location/tfdbg_dumps_1")]
```
Then this `hook` can be used in the same way as the `LocalCLIDebugHook` examples
described earlier in this document.
As the training and/or evalution of `Estimator` or `Experiment`
happens, tfdbg creates directories having the following name pattern:
`/shared/storage/location/tfdbg_dumps_1/run_<epoch_timestamp_microsec>_<uuid>`.
Each directory corresponds to a `Session.run()` call that underlies
the `fit()` or `evaluate()` call. You can load these directories and inspect
them in a command-line interface in an offline manner using the
`offline_analyzer` offered by tfdbg. For example:
```bash
python -m tensorflow.python.debug.cli.offline_analyzer \
--dump_dir="/shared/storage/location/tfdbg_dumps_1/run_<epoch_timestamp_microsec>_<uuid>"
```
## Frequently Asked Questions
**Q**: _Do the timestamps on the left side of the `lt` output reflect actual
performance in a non-debugging session?_
**A**: No. The debugger inserts additional special-purpose debug nodes to the
graph to record the values of intermediate tensors. These nodes
slow down the graph execution. If you are interested in profiling your
model, check out
1. The profiling mode of tfdbg: `tfdbg> run -p`.
2. [tfprof](https://github.com/tensorflow/tensorflow/tree/master/tensorflow/core/profiler)
and other profiling tools for TensorFlow.
**Q**: _How do I link tfdbg against my `Session` in Bazel? Why do I see an
error such as "ImportError: cannot import name debug"?_
**A**: In your BUILD rule, declare dependencies:
`"//tensorflow:tensorflow_py"` and `"//tensorflow/python/debug:debug_py"`.
The first is the dependency that you include to use TensorFlow even
without debugger support; the second enables the debugger.
Then, In your Python file, add:
```python
from tensorflow.python import debug as tf_debug
# Then wrap your TensorFlow Session with the local-CLI wrapper.
sess = tf_debug.LocalCLIDebugWrapperSession(sess)
```
**Q**: _Does tfdbg help debug runtime errors such as shape mismatches?_
**A**: Yes. tfdbg intercepts errors generated by ops during runtime and presents
the errors with some debug instructions to the user in the CLI.
See examples:
```none
# Debugging shape mismatch during matrix multiplication.
python -m tensorflow.python.debug.examples.debug_errors \
--error shape_mismatch --debug
# Debugging uninitialized variable.
python -m tensorflow.python.debug.examples.debug_errors \
--error uninitialized_variable --debug
```
**Q**: _How can I let my tfdbg-wrapped Sessions or Hooks run the debug mode
only from the main thread?_
**A**:
This is a common use case, in which the `Session` object is used from multiple
threads concurrently. Typically, the child threads take care of background tasks
such as running enqueue operations. Often, you want to debug only the main
thread (or less frequently, only one of the child threads). You can use the
`thread_name_filter` keyword argument of `LocalCLIDebugWrapperSession` to
achieve this type of thread-selective debugging. For example, to debug from the
main thread only, construct a wrapped `Session` as follows:
```python
sess = tf_debug.LocalCLIDebugWrapperSession(sess, thread_name_filter="MainThread$")
```
The above example relies on the fact that main threads in Python have the
default name `MainThread`.
**Q**: _The model I am debugging is very large. The data dumped by tfdbg
fills up the free space of my disk. What can I do?_
**A**:
You might encounter this problem in any of the following situations:
* models with many intermediate tensors
* very large intermediate tensors
* many @{tf.while_loop} iterations
There are three possible workarounds or solutions:
* The constructors of `LocalCLIDebugWrapperSession` and `LocalCLIDebugHook`
provide a keyword argument, `dump_root`, to specify the path
to which tfdbg dumps the debug data. You can use it to let tfdbg dump the
debug data on a disk with larger free space. For example:
``` python
# For LocalCLIDebugWrapperSession
sess = tf_debug.LocalCLIDebugWrapperSession(dump_root="/with/lots/of/space")
# For LocalCLIDebugHook
hooks = [tf_debug.LocalCLIDebugHook(dump_root="/with/lots/of/space")]
```
Make sure that the directory pointed to by dump_root is empty or nonexistent.
tfdbg cleans up the dump directories before exiting.
* Reduce the batch size used during the runs.
* Use the filtering options of tfdbg's `run` command to watch only specific
nodes in the graph. For example:
```
tfdbg> run --node_name_filter .*hidden.*
tfdbg> run --op_type_filter Variable.*
tfdbg> run --tensor_dtype_filter int.*
```
The first command above watches only nodes whose name match the
regular-expression pattern `.*hidden.*`. The second command watches only
operations whose name match the pattern `Variable.*`. The third one watches
only the tensors whose dtype match the pattern `int.*` (e.g., `int32`).
**Q**: _Why can't I select text in the tfdbg CLI?_
**A**: This is because the tfdbg CLI enables mouse events in the terminal by
default. This [mouse-mask](https://linux.die.net/man/3/mousemask) mode
overrides default terminal interactions, including text selection. You
can re-enable text selection by using the command `mouse off` or
`m off`.
**Q**: _Why does the tfdbg CLI show no dumped tensors when I debug code like the following?_
``` python
a = tf.ones([10], name="a")
b = tf.add(a, a, name="b")
sess = tf.Session()
sess = tf_debug.LocalCLIDebugWrapperSession(sess)
sess.run(b)
```
**A**: The reason why you see no data dumped is because every node in the
executed TensorFlow graph is constant-folded by the TensorFlow runtime.
In this exapmle, `a` is a constant tensor; therefore, the fetched
tensor `b` is effectively also a constant tensor. TensorFlow's graph
optimization folds the graph that contains `a` and `b` into a single
node to speed up future runs of the graph, which is why `tfdbg` does
not generate any intermediate tensor dumps. However, if `a` were a
@{tf.Variable}, as in the following example:
``` python
import numpy as np
a = tf.Variable(np.ones[10], name="a")
b = tf.add(a, a, name="b")
sess = tf.Session()
sess.run(tf.global_variables_initializer())
sess = tf_debug.LocalCLIDebugWrapperSession(sess)
sess.run(b)
```
the constant-folding would not occur and `tfdbg` should show the intermediate
tensor dumps.
|
