
diff options
Diffstat (limited to 'tensorflow/docs_src/guide/debugger.md')
| -rw-r--r-- | tensorflow/docs_src/guide/debugger.md | 814 |
1 files changed, 0 insertions, 814 deletions
diff --git a/tensorflow/docs_src/guide/debugger.md b/tensorflow/docs_src/guide/debugger.md deleted file mode 100644 index 5af27471a2..0000000000 --- a/tensorflow/docs_src/guide/debugger.md +++ /dev/null @@ -1,814 +0,0 @@ -# TensorFlow Debugger - -<!-- [comment]: TODO(barryr): Links to and from sections on "Graphs" & "Monitoring Learning". --> - -[TOC] - -`tfdbg` is a specialized debugger for TensorFlow. It lets you view the internal -structure and states of running TensorFlow graphs during training and inference, -which is difficult to debug with general-purpose debuggers such as Python's `pdb` -due to TensorFlow's computation-graph paradigm. - -This guide focuses on the command-line interface (CLI) of `tfdbg`. For guide on -how to use the graphical user interface (GUI) of tfdbg, i.e., the -**TensorBoard Debugger Plugin**, please visit -[its README](https://github.com/tensorflow/tensorboard/blob/master/tensorboard/plugins/debugger/README.md). - -Note: The TensorFlow debugger uses a -[curses](https://en.wikipedia.org/wiki/Curses_\(programming_library\))-based text -user interface. On Mac OS X, the `ncurses` library is required and can be -installed with `brew install ncurses`. On Windows, curses isn't as -well supported, so a [readline](https://en.wikipedia.org/wiki/GNU_Readline)-based -interface can be used with tfdbg by installing `pyreadline` with `pip`. If you -use Anaconda3, you can install it with a command such as -`"C:\Program Files\Anaconda3\Scripts\pip.exe" install pyreadline`. Unofficial -Windows curses packages can be downloaded -[here](https://www.lfd.uci.edu/~gohlke/pythonlibs/#curses), then subsequently -installed using `pip install <your_version>.whl`, however curses on Windows may -not work as reliably as curses on Linux or Mac. - -This tutorial demonstrates how to use the **tfdbg** CLI to debug the appearance -of [`nan`s](https://en.wikipedia.org/wiki/NaN) -and [`inf`s](https://en.wikipedia.org/wiki/Infinity), a frequently-encountered -type of bug in TensorFlow model development. -The following example is for users who use the low-level -[`Session`](https://www.tensorflow.org/api_docs/python/tf/Session) API of -TensorFlow. Later sections of this document describe how to use **tfdbg** -with higher-level APIs of TensorFlow, including `tf.estimator`, -`tf.keras` / `keras` and `tf.contrib.slim`. -To *observe* such an issue, run the following command without the debugger (the -source code can be found -[here](https://github.com/tensorflow/tensorflow/blob/master/tensorflow/python/debug/examples/debug_mnist.py)): - -```none -python -m tensorflow.python.debug.examples.debug_mnist -``` - -This code trains a simple neural network for MNIST digit image recognition. -Notice that the accuracy increases slightly after the first training step, but -then gets stuck at a low (near-chance) level: - -```none -Accuracy at step 0: 0.1113 -Accuracy at step 1: 0.3183 -Accuracy at step 2: 0.098 -Accuracy at step 3: 0.098 -Accuracy at step 4: 0.098 -``` - -Wondering what might have gone wrong, you suspect that certain nodes in the -training graph generated bad numeric values such as `inf`s and `nan`s, because -this is a common cause of this type of training failure. -Let's use tfdbg to debug this issue and pinpoint the exact graph node where this -numeric problem first surfaced. - -## Wrapping TensorFlow Sessions with tfdbg - -To add support for tfdbg in our example, all that is needed is to add the -following lines of code and wrap the Session object with a debugger wrapper. -This code is already added in -[debug_mnist.py](https://github.com/tensorflow/tensorflow/blob/master/tensorflow/python/debug/examples/debug_mnist.py), -so you can activate tfdbg CLI with the `--debug` flag at the command line. - -```python -# Let your BUILD target depend on "//tensorflow/python/debug:debug_py" -# (You don't need to worry about the BUILD dependency if you are using a pip -# install of open-source TensorFlow.) -from tensorflow.python import debug as tf_debug - -sess = tf_debug.LocalCLIDebugWrapperSession(sess) -``` - -This wrapper has the same interface as Session, so enabling debugging requires -no other changes to the code. The wrapper provides additional features, -including: - -* Bringing up a CLI before and after `Session.run()` calls, to let you -control the execution and inspect the graph's internal state. -* Allowing you to register special `filters` for tensor values, to facilitate -the diagnosis of issues. - -In this example, we have already registered a tensor filter called -`tfdbg.has_inf_or_nan`, -which simply determines if there are any `nan` or `inf` values in any -intermediate tensors (tensors that are neither inputs or outputs of the -`Session.run()` call, but are in the path leading from the inputs to the -outputs). This filter is for `nan`s and `inf`s is a common enough use case that -we ship it with the -[`debug_data`](../api_guides/python/tfdbg.md#Classes_for_debug_dump_data_and_directories) -module. - -Note: You can also write your own custom filters. See `tfdbg.DebugDumpDir.find` -for additional information. - -## Debugging Model Training with tfdbg - -Let's try training the model again, but with the `--debug` flag added this time: - -```none -python -m tensorflow.python.debug.examples.debug_mnist --debug -``` - -The debug wrapper session will prompt you when it is about to execute the first -`Session.run()` call, with information regarding the fetched tensor and feed -dictionaries displayed on the screen. - -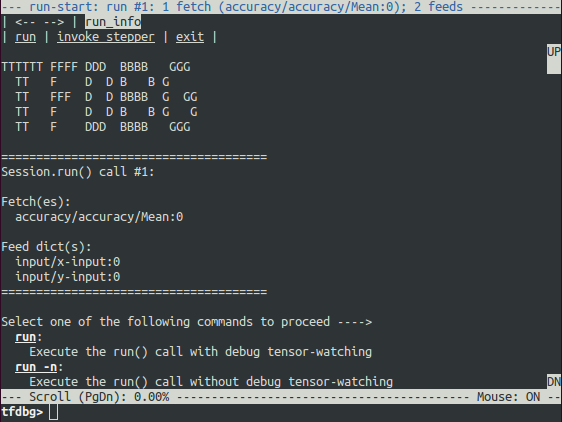 - -This is what we refer to as the *run-start CLI*. It lists the feeds and fetches -to the current `Session.run` call, before executing anything. - -If the screen size is too small to display the content of the message in its -entirety, you can resize it. - -Use the **PageUp** / **PageDown** / **Home** / **End** keys to navigate the -screen output. On most keyboards lacking those keys **Fn + Up** / -**Fn + Down** / **Fn + Right** / **Fn + Left** will work. - -Enter the `run` command (or just `r`) at the command prompt: - -``` -tfdbg> run -``` - -The `run` command causes tfdbg to execute until the end of the next -`Session.run()` call, which calculates the model's accuracy using a test data -set. tfdbg augments the runtime Graph to dump all intermediate tensors. -After the run ends, tfdbg displays all the dumped tensors values in the -*run-end CLI*. For example: - -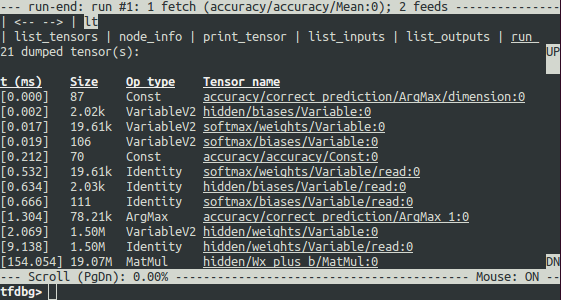 - -This list of tensors can also be obtained by running the command `lt` after you -executed `run`. - -### tfdbg CLI Frequently-Used Commands - -Try the following commands at the `tfdbg>` prompt (referencing the code at -`tensorflow/python/debug/examples/debug_mnist.py`): - -| Command | Syntax or Option | Explanation | Example | -|:-------------------|:---------------- |:------------ |:------------------------- | -| **`lt`** | | **List dumped tensors.** | `lt` | -| | `-n <name_pattern>` | List dumped tensors with names matching given regular-expression pattern. | `lt -n Softmax.*` | -| | `-t <op_pattern>` | List dumped tensors with op types matching given regular-expression pattern. | `lt -t MatMul` | -| | `-f <filter_name>` | List only the tensors that pass a registered tensor filter. | `lt -f has_inf_or_nan` | -| | `-f <filter_name> -fenn <regex>` | List only the tensors that pass a registered tensor filter, excluding nodes with names matching the regular expression. | `lt -f has_inf_or_nan` `-fenn .*Sqrt.*` | -| | `-s <sort_key>` | Sort the output by given `sort_key`, whose possible values are `timestamp` (default), `dump_size`, `op_type` and `tensor_name`. | `lt -s dump_size` | -| | `-r` | Sort in reverse order. | `lt -r -s dump_size` | -| **`pt`** | | **Print value of a dumped tensor.** | | -| | `pt <tensor>` | Print tensor value. | `pt hidden/Relu:0` | -| | `pt <tensor>[slicing]` | Print a subarray of tensor, using [numpy](http://www.numpy.org/)-style array slicing. | `pt hidden/Relu:0[0:50,:]` | -| | `-a` | Print the entirety of a large tensor, without using ellipses. (May take a long time for large tensors.) | `pt -a hidden/Relu:0[0:50,:]` | -| | `-r <range>` | Highlight elements falling into specified numerical range. Multiple ranges can be used in conjunction. | `pt hidden/Relu:0 -a -r [[-inf,-1],[1,inf]]` | -| | `-n <number>` | Print dump corresponding to specified 0-based dump number. Required for tensors with multiple dumps. | `pt -n 0 hidden/Relu:0` | -| | `-s` | Include a summary of the numeric values of the tensor (applicable only to non-empty tensors with Boolean and numeric types such as `int*` and `float*`.) | `pt -s hidden/Relu:0[0:50,:]` | -| | `-w` | Write the value of the tensor (possibly sliced) to a Numpy file using [`numpy.save()`](https://docs.scipy.org/doc/numpy-1.13.0/reference/generated/numpy.save.html) | `pt -s hidden/Relu:0 -w /tmp/relu.npy` | -| **`@[coordinates]`** | | Navigate to specified element in `pt` output. | `@[10,0]` or `@10,0` | -| **`/regex`** | | [less](https://linux.die.net/man/1/less)-style search for given regular expression. | `/inf` | -| **`/`** | | Scroll to the next line with matches to the searched regex (if any). | `/` | -| **`pf`** | | **Print a value in the feed_dict to `Session.run`.** | | -| | `pf <feed_tensor_name>` | Print the value of the feed. Also note that the `pf` command has the `-a`, `-r` and `-s` flags (not listed below), which have the same syntax and semantics as the identically-named flags of `pt`. | `pf input_xs:0` | -| **eval** | | **Evaluate arbitrary Python and numpy expression.** | | -| | `eval <expression>` | Evaluate a Python / numpy expression, with numpy available as `np` and debug tensor names enclosed in backticks. | ``eval "np.matmul((`output/Identity:0` / `Softmax:0`).T, `Softmax:0`)"`` | -| | `-a` | Print a large-sized evaluation result in its entirety, i.e., without using ellipses. | ``eval -a 'np.sum(`Softmax:0`, axis=1)'`` | -| | `-w` | Write the result of the evaluation to a Numpy file using [`numpy.save()`](https://docs.scipy.org/doc/numpy-1.13.0/reference/generated/numpy.save.html) | ``eval -a 'np.sum(`Softmax:0`, axis=1)' -w /tmp/softmax_sum.npy`` | -| **`ni`** | | **Display node information.** | | -| | `-a` | Include node attributes in the output. | `ni -a hidden/Relu` | -| | `-d` | List the debug dumps available from the node. | `ni -d hidden/Relu` | -| | `-t` | Display the Python stack trace of the node's creation. | `ni -t hidden/Relu` | -| **`li`** | | **List inputs to node** | | -| | `-r` | List the inputs to node, recursively (the input tree.) | `li -r hidden/Relu:0` | -| | `-d <max_depth>` | Limit recursion depth under the `-r` mode. | `li -r -d 3 hidden/Relu:0` | -| | `-c` | Include control inputs. | `li -c -r hidden/Relu:0` | -| | `-t` | Show op types of input nodes. | `li -t -r hidden/Relu:0` | -| **`lo`** | | **List output recipients of node** | | -| | `-r` | List the output recipients of node, recursively (the output tree.) | `lo -r hidden/Relu:0` | -| | `-d <max_depth>` | Limit recursion depth under the `-r` mode. | `lo -r -d 3 hidden/Relu:0` | -| | `-c` | Include recipients via control edges. | `lo -c -r hidden/Relu:0` | -| | `-t` | Show op types of recipient nodes. | `lo -t -r hidden/Relu:0` | -| **`ls`** | | **List Python source files involved in node creation.** | | -| | `-p <path_pattern>` | Limit output to source files matching given regular-expression path pattern. | `ls -p .*debug_mnist.*` | -| | `-n` | Limit output to node names matching given regular-expression pattern. | `ls -n Softmax.*` | -| **`ps`** | | **Print Python source file.** | | -| | `ps <file_path>` | Print given Python source file source.py, with the lines annotated with the nodes created at each of them (if any). | `ps /path/to/source.py` | -| | `-t` | Perform annotation with respect to Tensors, instead of the default, nodes. | `ps -t /path/to/source.py` | -| | `-b <line_number>` | Annotate source.py beginning at given line. | `ps -b 30 /path/to/source.py` | -| | `-m <max_elements>` | Limit the number of elements in the annotation for each line. | `ps -m 100 /path/to/source.py` | -| **`run`** | | **Proceed to the next Session.run()** | `run` | -| | `-n` | Execute through the next `Session.run` without debugging, and drop to CLI right before the run after that. | `run -n` | -| | `-t <T>` | Execute `Session.run` `T - 1` times without debugging, followed by a run with debugging. Then drop to CLI right after the debugged run. | `run -t 10` | -| | `-f <filter_name>` | Continue executing `Session.run` until any intermediate tensor triggers the specified Tensor filter (causes the filter to return `True`). | `run -f has_inf_or_nan` | -| | `-f <filter_name> -fenn <regex>` | Continue executing `Session.run` until any intermediate tensor whose node names doesn't match the regular expression triggers the specified Tensor filter (causes the filter to return `True`). | `run -f has_inf_or_nan -fenn .*Sqrt.*` | -| | `--node_name_filter <pattern>` | Execute the next `Session.run`, watching only nodes with names matching the given regular-expression pattern. | `run --node_name_filter Softmax.*` | -| | `--op_type_filter <pattern>` | Execute the next `Session.run`, watching only nodes with op types matching the given regular-expression pattern. | `run --op_type_filter Variable.*` | -| | `--tensor_dtype_filter <pattern>` | Execute the next `Session.run`, dumping only Tensors with data types (`dtype`s) matching the given regular-expression pattern. | `run --tensor_dtype_filter int.*` | -| | `-p` | Execute the next `Session.run` call in profiling mode. | `run -p` | -| **`ri`** | | **Display information about the run the current run, including fetches and feeds.** | `ri` | -| **`config`** | | **Set or show persistent TFDBG UI configuration.** | | -| | `set` | Set the value of a config item: {`graph_recursion_depth`, `mouse_mode`}. | `config set graph_recursion_depth 3` | -| | `show` | Show current persistent UI configuration. | `config show` | -| **`version`** | | **Print the version of TensorFlow and its key dependencies.** | `version` | -| **`help`** | | **Print general help information** | `help` | -| | `help <command>` | Print help for given command. | `help lt` | - -Note that each time you enter a command, a new screen output -will appear. This is somewhat analogous to web pages in a browser. You can -navigate between these screens by clicking the `<--` and -`-->` text arrows near the top-left corner of the CLI. - -### Other Features of the tfdbg CLI - -In addition to the commands listed above, the tfdbg CLI provides the following -additional features: - -* To navigate through previous tfdbg commands, type in a few characters - followed by the Up or Down arrow keys. tfdbg will show you the history of - commands that started with those characters. -* To navigate through the history of screen outputs, do either of the - following: - * Use the `prev` and `next` commands. - * Click underlined `<--` and `-->` links near the top left corner of the - screen. -* Tab completion of commands and some command arguments. -* To redirect the screen output to a file instead of the screen, end the - command with bash-style redirection. For example, the following command - redirects the output of the pt command to the `/tmp/xent_value_slices.txt` - file: - - ```none - tfdbg> pt cross_entropy/Log:0[:, 0:10] > /tmp/xent_value_slices.txt - ``` - -### Finding `nan`s and `inf`s - -In this first `Session.run()` call, there happen to be no problematic numerical -values. You can move on to the next run by using the command `run` or its -shorthand `r`. - -> TIP: If you enter `run` or `r` repeatedly, you will be able to move through -> the `Session.run()` calls in a sequential manner. -> -> You can also use the `-t` flag to move ahead a number of `Session.run()` calls -> at a time, for example: -> -> ``` -> tfdbg> run -t 10 -> ``` - -Instead of entering `run` repeatedly and manually searching for `nan`s and -`inf`s in the run-end UI after every `Session.run()` call (for example, by using -the `pt` command shown in the table above) , you can use the following -command to let the debugger repeatedly execute `Session.run()` calls without -stopping at the run-start or run-end prompt, until the first `nan` or `inf` -value shows up in the graph. This is analogous to *conditional breakpoints* in -some procedural-language debuggers: - -```none -tfdbg> run -f has_inf_or_nan -``` - -> NOTE: The preceding command works properly because a tensor filter called -> `has_inf_or_nan` has been registered for you when the wrapped session is -> created. This filter detects `nan`s and `inf`s (as explained previously). -> If you have registered any other filters, you can -> use "run -f" to have tfdbg run until any tensor triggers that filter (cause -> the filter to return True). -> -> ``` python -> def my_filter_callable(datum, tensor): -> # A filter that detects zero-valued scalars. -> return len(tensor.shape) == 0 and tensor == 0.0 -> -> sess.add_tensor_filter('my_filter', my_filter_callable) -> ``` -> -> Then at the tfdbg run-start prompt run until your filter is triggered: -> -> ``` -> tfdbg> run -f my_filter -> ``` - -See [this API document](https://www.tensorflow.org/api_docs/python/tfdbg/DebugDumpDir#find) -for more information on the expected signature and return value of the predicate -`Callable` used with `add_tensor_filter()`. - -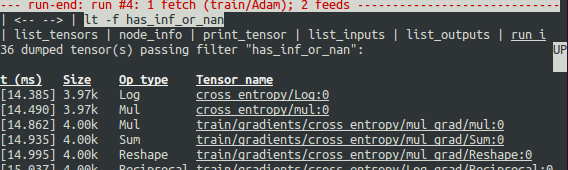 - -As the screen display indicates on the first line, the `has_inf_or_nan` filter is first triggered -during the fourth `Session.run()` call: an -[Adam optimizer](https://www.tensorflow.org/api_docs/python/tf/train/AdamOptimizer) -forward-backward training pass on the graph. In this run, 36 (out of the total -95) intermediate tensors contain `nan` or `inf` values. These tensors are listed -in chronological order, with their timestamps displayed on the left. At the top -of the list, you can see the first tensor in which the bad numerical values -first surfaced: `cross_entropy/Log:0`. - -To view the value of the tensor, click the underlined tensor name -`cross_entropy/Log:0` or enter the equivalent command: - -```none -tfdbg> pt cross_entropy/Log:0 -``` - -Scroll down a little and you will notice some scattered `inf` values. If the -instances of `inf` and `nan` are difficult to spot by eye, you can use the -following command to perform a regex search and highlight the output: - -```none -tfdbg> /inf -``` - -Or, alternatively: - -```none -tfdbg> /(inf|nan) -``` - -You can also use the `-s` or `--numeric_summary` command to get a quick summary -of the types of numeric values in the tensor: - -``` none -tfdbg> pt -s cross_entropy/Log:0 -``` - -From the summary, you can see that several of the 1000 elements of the -`cross_entropy/Log:0` tensor are `-inf`s (negative infinities). - -Why did these infinities appear? To further debug, display more information -about the node `cross_entropy/Log` by clicking the underlined `node_info` menu -item on the top or entering the equivalent node_info (`ni`) command: - -```none -tfdbg> ni cross_entropy/Log -``` - -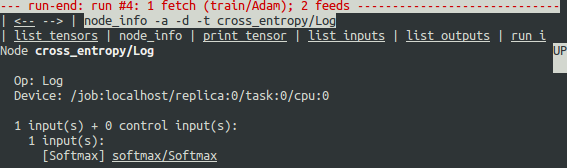 - -You can see that this node has the op type `Log` -and that its input is the node `Softmax`. Run the following command to -take a closer look at the input tensor: - -```none -tfdbg> pt Softmax:0 -``` - -Examine the values in the input tensor, searching for zeros: - -```none -tfdbg> /0\.000 -``` - -Indeed, there are zeros. Now it is clear that the origin of the bad numerical -values is the node `cross_entropy/Log` taking logs of zeros. To find out the -culprit line in the Python source code, use the `-t` flag of the `ni` command -to show the traceback of the node's construction: - -```none -tfdbg> ni -t cross_entropy/Log -``` - -If you click "node_info" at the top of the screen, tfdbg automatically shows the -traceback of the node's construction. - -From the traceback, you can see that the op is constructed at the following -line: -[`debug_mnist.py`](https://www.tensorflow.org/code/tensorflow/python/debug/examples/debug_mnist.py): - -```python -diff = y_ * tf.log(y) -``` - -**tfdbg** has a feature that makes it easy to trace Tensors and ops back to -lines in Python source files. It can annotate lines of a Python file with -the ops or Tensors created by them. To use this feature, -simply click the underlined line numbers in the stack trace output of the -`ni -t <op_name>` commands, or use the `ps` (or `print_source`) command such as: -`ps /path/to/source.py`. For example, the following screenshot shows the output -of a `ps` command. - -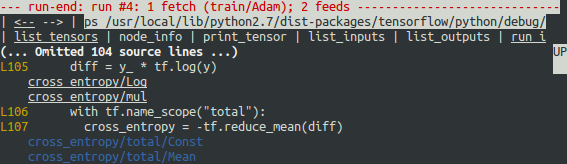 - -### Fixing the problem - -To fix the problem, edit `debug_mnist.py`, changing the original line: - -```python -diff = -(y_ * tf.log(y)) -``` - -to the built-in, numerically-stable implementation of softmax cross-entropy: - -```python -diff = tf.losses.softmax_cross_entropy(labels=y_, logits=logits) -``` - -Rerun with the `--debug` flag as follows: - -```none -python -m tensorflow.python.debug.examples.debug_mnist --debug -``` - -At the `tfdbg>` prompt, enter the following command: - -```none -run -f has_inf_or_nan` -``` - -Confirm that no tensors are flagged as containing `nan` or `inf` values, and -accuracy now continues to rise rather than getting stuck. Success! - -## Debugging TensorFlow Estimators - -This section explains how to debug TensorFlow programs that use the `Estimator` -APIs. Part of the convenience provided by these APIs is that -they manage `Session`s internally. This makes the `LocalCLIDebugWrapperSession` -described in the preceding sections inapplicable. Fortunately, you can still -debug them by using special `hook`s provided by `tfdbg`. - -`tfdbg` can debug the -`tf.estimator.Estimator.train`, -`tf.estimator.Estimator.evaluate` and -`tf.estimator.Estimator.predict` -methods of tf-learn `Estimator`s. To debug `Estimator.train()`, -create a `LocalCLIDebugHook` and supply it in the `hooks` argument. For example: - -```python -# First, let your BUILD target depend on "//tensorflow/python/debug:debug_py" -# (You don't need to worry about the BUILD dependency if you are using a pip -# install of open-source TensorFlow.) -from tensorflow.python import debug as tf_debug - -# Create a LocalCLIDebugHook and use it as a monitor when calling fit(). -hooks = [tf_debug.LocalCLIDebugHook()] - -# To debug `train`: -classifier.train(input_fn, - steps=1000, - hooks=hooks) -``` - -Similarly, to debug `Estimator.evaluate()` and `Estimator.predict()`, assign -hooks to the `hooks` parameter, as in the following example: - -```python -# To debug `evaluate`: -accuracy_score = classifier.evaluate(eval_input_fn, - hooks=hooks)["accuracy"] - -# To debug `predict`: -predict_results = classifier.predict(predict_input_fn, hooks=hooks) -``` - -[debug_tflearn_iris.py](https://www.tensorflow.org/code/tensorflow/python/debug/examples/debug_tflearn_iris.py), -contains a full example of how to use the tfdbg with `Estimator`s. -To run this example, do: - -```none -python -m tensorflow.python.debug.examples.debug_tflearn_iris --debug -``` - -The `LocalCLIDebugHook` also allows you to configure a `watch_fn` that can be -used to flexibly specify what `Tensor`s to watch on different `Session.run()` -calls, as a function of the `fetches` and `feed_dict` and other states. See -`tfdbg.DumpingDebugWrapperSession.__init__` -for more details. - -## Debugging Keras Models with TFDBG - -To use TFDBG with -[tf.keras](https://www.tensorflow.org/api_docs/python/tf/keras), -let the Keras backend use a TFDBG-wrapped Session object. For example, to use -the CLI wrapper: - -``` python -import tensorflow as tf -from tensorflow.python import debug as tf_debug - -tf.keras.backend.set_session(tf_debug.LocalCLIDebugWrapperSession(tf.Session())) - -# Define your keras model, called "model". - -# Calls to `fit()`, 'evaluate()` and `predict()` methods will break into the -# TFDBG CLI. -model.fit(...) -model.evaluate(...) -model.predict(...) -``` - -With minor modification, the preceding code example also works for the -[non-TensorFlow version of Keras](https://keras.io/) running against a -TensorFlow backend. You just need to replace `tf.keras.backend` with -`keras.backend`. - -## Debugging tf-slim with TFDBG - -TFDBG supports debugging of training and evaluation with -[tf-slim](https://github.com/tensorflow/tensorflow/tree/master/tensorflow/contrib/slim). -As detailed below, training and evaluation require slightly different debugging -workflows. - -### Debugging training in tf-slim -To debug the training process, provide `LocalCLIDebugWrapperSession` to the -`session_wrapper` argument of `slim.learning.train()`. For example: - -``` python -import tensorflow as tf -from tensorflow.python import debug as tf_debug - -# ... Code that creates the graph and the train_op ... -tf.contrib.slim.learning.train( - train_op, - logdir, - number_of_steps=10, - session_wrapper=tf_debug.LocalCLIDebugWrapperSession) -``` - -### Debugging evaluation in tf-slim -To debug the evaluation process, provide `LocalCLIDebugHook` to the -`hooks` argument of `slim.evaluation.evaluate_once()`. For example: - -``` python -import tensorflow as tf -from tensorflow.python import debug as tf_debug - -# ... Code that creates the graph and the eval and final ops ... -tf.contrib.slim.evaluation.evaluate_once( - '', - checkpoint_path, - logdir, - eval_op=my_eval_op, - final_op=my_value_op, - hooks=[tf_debug.LocalCLIDebugHook()]) -``` - -## Offline Debugging of Remotely-Running Sessions - -Often, your model is running on a remote machine or a process that you don't -have terminal access to. To perform model debugging in such cases, you can use -the `offline_analyzer` binary of `tfdbg` (described below). It operates on -dumped data directories. This can be done to both the lower-level `Session` API -and the higher-level `Estimator` API. - -### Debugging Remote tf.Sessions - -If you interact directly with the `tf.Session` API in `python`, you can -configure the `RunOptions` proto that you call your `Session.run()` method -with, by using the method `tfdbg.watch_graph`. -This will cause the intermediate tensors and runtime graphs to be dumped to a -shared storage location of your choice when the `Session.run()` call occurs -(at the cost of slower performance). For example: - -```python -from tensorflow.python import debug as tf_debug - -# ... Code where your session and graph are set up... - -run_options = tf.RunOptions() -tf_debug.watch_graph( - run_options, - session.graph, - debug_urls=["file:///shared/storage/location/tfdbg_dumps_1"]) -# Be sure to specify different directories for different run() calls. - -session.run(fetches, feed_dict=feeds, options=run_options) -``` - -Later, in an environment that you have terminal access to (for example, a local -computer that can access the shared storage location specified in the code -above), you can load and inspect the data in the dump directory on the shared -storage by using the `offline_analyzer` binary of `tfdbg`. For example: - -```none -python -m tensorflow.python.debug.cli.offline_analyzer \ - --dump_dir=/shared/storage/location/tfdbg_dumps_1 -``` - -The `Session` wrapper `DumpingDebugWrapperSession` offers an easier and more -flexible way to generate file-system dumps that can be analyzed offline. -To use it, simply wrap your session in a `tf_debug.DumpingDebugWrapperSession`. -For example: - -```python -# Let your BUILD target depend on "//tensorflow/python/debug:debug_py -# (You don't need to worry about the BUILD dependency if you are using a pip -# install of open-source TensorFlow.) -from tensorflow.python import debug as tf_debug - -sess = tf_debug.DumpingDebugWrapperSession( - sess, "/shared/storage/location/tfdbg_dumps_1/", watch_fn=my_watch_fn) -``` - -The `watch_fn` argument accepts a `Callable` that allows you to configure what -`tensor`s to watch on different `Session.run()` calls, as a function of the -`fetches` and `feed_dict` to the `run()` call and other states. - -### C++ and other languages - -If your model code is written in C++ or other languages, you can also -modify the `debug_options` field of `RunOptions` to generate debug dumps that -can be inspected offline. See -[the proto definition](https://www.tensorflow.org/code/tensorflow/core/protobuf/debug.proto) -for more details. - -### Debugging Remotely-Running Estimators - -If your remote TensorFlow server runs `Estimator`s, -you can use the non-interactive `DumpingDebugHook`. For example: - -```python -# Let your BUILD target depend on "//tensorflow/python/debug:debug_py -# (You don't need to worry about the BUILD dependency if you are using a pip -# install of open-source TensorFlow.) -from tensorflow.python import debug as tf_debug - -hooks = [tf_debug.DumpingDebugHook("/shared/storage/location/tfdbg_dumps_1")] -``` - -Then this `hook` can be used in the same way as the `LocalCLIDebugHook` examples -described earlier in this document. -As the training, evaluation or prediction happens with `Estimator`, -tfdbg creates directories having the following name pattern: -`/shared/storage/location/tfdbg_dumps_1/run_<epoch_timestamp_microsec>_<uuid>`. -Each directory corresponds to a `Session.run()` call that underlies -the `fit()` or `evaluate()` call. You can load these directories and inspect -them in a command-line interface in an offline manner using the -`offline_analyzer` offered by tfdbg. For example: - -```bash -python -m tensorflow.python.debug.cli.offline_analyzer \ - --dump_dir="/shared/storage/location/tfdbg_dumps_1/run_<epoch_timestamp_microsec>_<uuid>" -``` - -## Frequently Asked Questions - -**Q**: _Do the timestamps on the left side of the `lt` output reflect actual - performance in a non-debugging session?_ - -**A**: No. The debugger inserts additional special-purpose debug nodes to the - graph to record the values of intermediate tensors. These nodes - slow down the graph execution. If you are interested in profiling your - model, check out - - 1. The profiling mode of tfdbg: `tfdbg> run -p`. - 2. [tfprof](https://github.com/tensorflow/tensorflow/tree/master/tensorflow/core/profiler) - and other profiling tools for TensorFlow. - -**Q**: _How do I link tfdbg against my `Session` in Bazel? Why do I see an - error such as "ImportError: cannot import name debug"?_ - -**A**: In your BUILD rule, declare dependencies: - `"//tensorflow:tensorflow_py"` and `"//tensorflow/python/debug:debug_py"`. - The first is the dependency that you include to use TensorFlow even - without debugger support; the second enables the debugger. - Then, In your Python file, add: - -```python -from tensorflow.python import debug as tf_debug - -# Then wrap your TensorFlow Session with the local-CLI wrapper. -sess = tf_debug.LocalCLIDebugWrapperSession(sess) -``` - -**Q**: _Does tfdbg help debug runtime errors such as shape mismatches?_ - -**A**: Yes. tfdbg intercepts errors generated by ops during runtime and presents - the errors with some debug instructions to the user in the CLI. - See examples: - -```none -# Debugging shape mismatch during matrix multiplication. -python -m tensorflow.python.debug.examples.debug_errors \ - --error shape_mismatch --debug - -# Debugging uninitialized variable. -python -m tensorflow.python.debug.examples.debug_errors \ - --error uninitialized_variable --debug -``` - -**Q**: _How can I let my tfdbg-wrapped Sessions or Hooks run the debug mode -only from the main thread?_ - -**A**: -This is a common use case, in which the `Session` object is used from multiple -threads concurrently. Typically, the child threads take care of background tasks -such as running enqueue operations. Often, you want to debug only the main -thread (or less frequently, only one of the child threads). You can use the -`thread_name_filter` keyword argument of `LocalCLIDebugWrapperSession` to -achieve this type of thread-selective debugging. For example, to debug from the -main thread only, construct a wrapped `Session` as follows: - -```python -sess = tf_debug.LocalCLIDebugWrapperSession(sess, thread_name_filter="MainThread$") -``` - -The above example relies on the fact that main threads in Python have the -default name `MainThread`. - -**Q**: _The model I am debugging is very large. The data dumped by tfdbg -fills up the free space of my disk. What can I do?_ - -**A**: -You might encounter this problem in any of the following situations: - -* models with many intermediate tensors -* very large intermediate tensors -* many `tf.while_loop` iterations - -There are three possible workarounds or solutions: - -* The constructors of `LocalCLIDebugWrapperSession` and `LocalCLIDebugHook` - provide a keyword argument, `dump_root`, to specify the path - to which tfdbg dumps the debug data. You can use it to let tfdbg dump the - debug data on a disk with larger free space. For example: - -```python -# For LocalCLIDebugWrapperSession -sess = tf_debug.LocalCLIDebugWrapperSession(dump_root="/with/lots/of/space") - -# For LocalCLIDebugHook -hooks = [tf_debug.LocalCLIDebugHook(dump_root="/with/lots/of/space")] -``` - Make sure that the directory pointed to by dump_root is empty or nonexistent. - `tfdbg` cleans up the dump directories before exiting. - -* Reduce the batch size used during the runs. -* Use the filtering options of tfdbg's `run` command to watch only specific - nodes in the graph. For example: - - ``` - tfdbg> run --node_name_filter .*hidden.* - tfdbg> run --op_type_filter Variable.* - tfdbg> run --tensor_dtype_filter int.* - ``` - - The first command above watches only nodes whose name match the - regular-expression pattern `.*hidden.*`. The second command watches only - operations whose name match the pattern `Variable.*`. The third one watches - only the tensors whose dtype match the pattern `int.*` (e.g., `int32`). - - -**Q**: _Why can't I select text in the tfdbg CLI?_ - -**A**: This is because the tfdbg CLI enables mouse events in the terminal by - default. This [mouse-mask](https://linux.die.net/man/3/mousemask) mode - overrides default terminal interactions, including text selection. You - can re-enable text selection by using the command `mouse off` or - `m off`. - -**Q**: _Why does the tfdbg CLI show no dumped tensors when I debug code like the following?_ - -``` python -a = tf.ones([10], name="a") -b = tf.add(a, a, name="b") -sess = tf.Session() -sess = tf_debug.LocalCLIDebugWrapperSession(sess) -sess.run(b) -``` - -**A**: The reason why you see no data dumped is because every node in the - executed TensorFlow graph is constant-folded by the TensorFlow runtime. - In this example, `a` is a constant tensor; therefore, the fetched - tensor `b` is effectively also a constant tensor. TensorFlow's graph - optimization folds the graph that contains `a` and `b` into a single - node to speed up future runs of the graph, which is why `tfdbg` does - not generate any intermediate tensor dumps. However, if `a` were a - `tf.Variable`, as in the following example: - -``` python -import numpy as np - -a = tf.Variable(np.ones(10), name="a") -b = tf.add(a, a, name="b") -sess = tf.Session() -sess.run(tf.global_variables_initializer()) -sess = tf_debug.LocalCLIDebugWrapperSession(sess) -sess.run(b) -``` - -the constant-folding would not occur and `tfdbg` should show the intermediate -tensor dumps. - - -**Q**: I am debugging a model that generates unwanted infinities or NaNs. But - there are some nodes in my model that are known to generate infinities - or NaNs in their output tensors even under completely normal conditions. - How can I skip those nodes during my `run -f has_inf_or_nan` actions? - -**A**: Use the `--filter_exclude_node_names` (`-fenn` for short) flag. For - example, if you known you have a node with name matching the regular - expression `.*Sqrt.*` that generates infinities or NaNs regardless - of whether the model is behaving correctly, you can exclude the nodes - from the infinity/NaN-finding runs with the command - `run -f has_inf_or_nan -fenn .*Sqrt.*`. - - -**Q**: Is there a GUI for tfdbg? - -**A**: Yes, the **TensorBoard Debugger Plugin** is the GUI of tfdbg. - It offers features such as inspection of the computation graph, - real-time visualization of tensor values, continuation to tensor - and conditional breakpoints, and tying tensors to their - graph-construction source code, all in the browser environment. - To get started, please visit - [its README](https://github.com/tensorflow/tensorboard/blob/master/tensorboard/plugins/debugger/README.md). |